
|
|
|
 |
What is Marine Debris? |
Marine debris is any human-made trash that is thrown out and discarded in the ocean. Even though debris is produced in one country, they can arrive to many other countries traveling across the ocean.
Every year, it is estimated that over a billion pounds of debris are thrown into the ocean. Typical types of marine debris are plastics, glass, cloth, derelict fishing gear, metals, rubber, and vessels. These greatly pollute the ocean and threaten the life of many marine communities. Debris that is washed to shore also takes away the beauty from beaches and damage habitat on land.
Marine debris comes from the land and ocean. On land, litter on roadways makes their ways to the ocean by storm drains, canals, rivers, or streams. Debris from the ocean comes from boats or platforms. Derelict fishing gears, which are fishing lines, nets, crab pots or other equipment used to catch fish, have become more harmful as well. Fishing equipment that was once made by natural fibers has been replaced by materials such as nylon, polyethylene, and polypropylene for higher efficiency. This makes them very difficult to degrade and so they remain in the ocean for a longer period of time or are consumed by marine species.
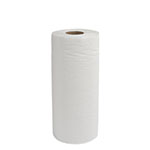
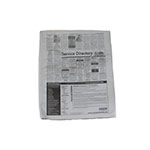
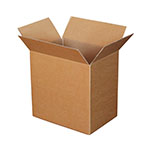
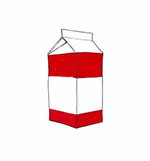
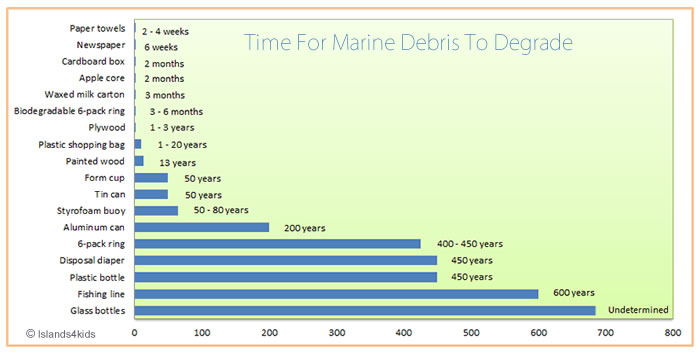
Once in the ocean, while some debris can biodegrade, or break down, to smaller pieces, human-made debris cannot completely degrade. Some debris may even take hundreds of years to degrade. Factors such as material, thickness, and environmental condition of the debris contribute to rate of degradation.1 Take a look at the table below to see just how long different types of material take to break down to smaller fragments. |
 |
Time for Marine Debris to Degrade |
 |
 |
 |
| Paper towels |
newspaper |
Cardboard box |
| 2-4 weeks |
6 weeks |
2 months |
 |
 |
 |
 |
| Apple core |
Waxed milk carton |
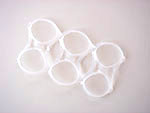
Biodegradable 6-pack ring |
| 2 months |
3 months |
3 to 6 months |
 |
 |
 |
 |
| Plywood |
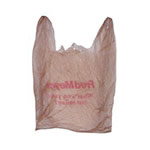
shopping bag |
Painted wood |
| 1-3 years |
1-20 years |
13 years |
 |
 |
 |
 |
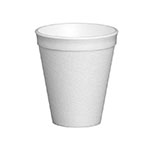
| Foam cup |
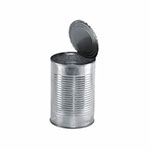
Tin can |
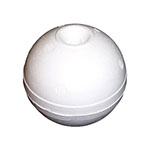
Styrofoam buoy |
| 50 years |
50 years |
50 - 80 years |
 |
 |
 |
 |
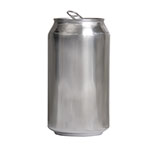
| Aluminum |
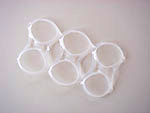
6-pack ring |
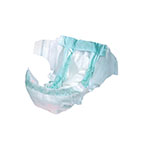
Disposable diaper |
| 200 years |
400 - 450 years |
450 years |
 |
 |
 |
 |
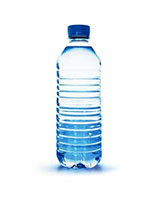
| Plastic bottles |
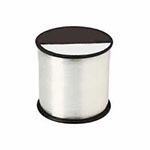
Fishing line (microfilament) |
Glass Bottles/Jars |
| 450 years |
600 years |
Undetermined |
|
 |

|
Types of marine debris |
| |
|
|
 |
Correlation between the type of plastic and their depth in the ocean |
| |
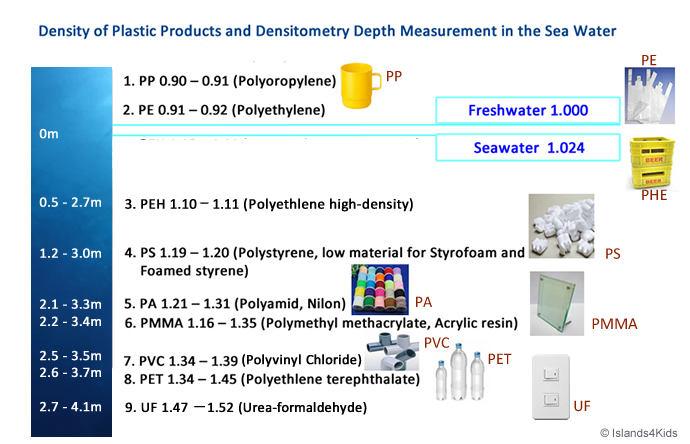
Only a small portion of plastic marine debris are visible and are floating on the surface of the ocean, while a larger proportion of plastic debris sink below. |
| |
| |
A. Specific gravity: |
| |
|
This diagram illustrates the approximate depth distribution of each plastic product based on the value of specific gravity. Specific gravity is the density of the object divided by the density of water. |
| |
B. Filler: |
| |
|
All plastic products are not made of a single material, but the amalgamation of many other compound additives called “filler” to increase usability or improve design flexibility. If the ratio of filler changes, the value of specific gravity changes as well. The depth distribution is always closely interconnected with the specific gravity of each plastic product. |
| |
|
| |
D. Salinity: |
| |
|
Change in salinity (amount of salt dissolved in water) concentration at different depths of water also influences the existing depth of plastic marine debris. |
| |
|
| |
E. Plastic marine debris exists at any depth of the ocean: |
| |
|
They are found at almost any depth, from the ocean surface to the bottom of the 10,000 meter (6 miles) deep sea bed. |
 |
Survey Tools |
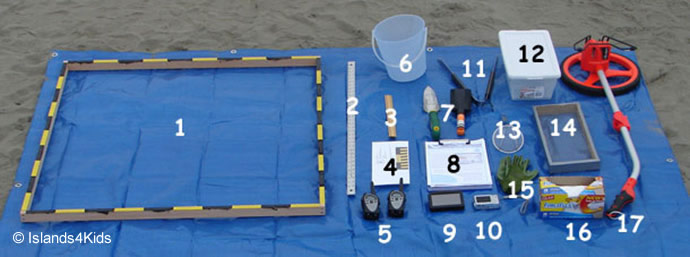
| 1. |
Quadrat (1 ㎡ = 100cm x 100 cm with 10cm makers) |
| 2. |
35 inches Ruler |
| 3. |
30 cm Ruler |
| 4. |
15 cm Photo Ruler |
| 5. |
Walkie Talkies |
| 6. |
Bucket to sort out plastic pellets and Nurdles |
| 7. |
Garden Shovel |
| 8. |
Data sheets and Clipboard |
| 9. |
GPS (Global Positioning System) |
| 10. |
Camera |
| 11. |
Tongs to pick up syringes and unhygienic items |
| 12. |
Container for syringes and clinical devices |
| 13. |
1 m/m mesh screen sifter for plastic pellets and Nurdles |
| 14. |
5 m/m mesh screen sifter |
| 15. |
Rubber-coated gloves |
| 16. |
Trash bags |
| 17. |
Wheel distance measuring or reel measuring tape |
|
|
 |
|
 |
Here are 2 basic approaches to help keep beaches clean. |
|
| |
 |
Proactive |
|
| |
 |
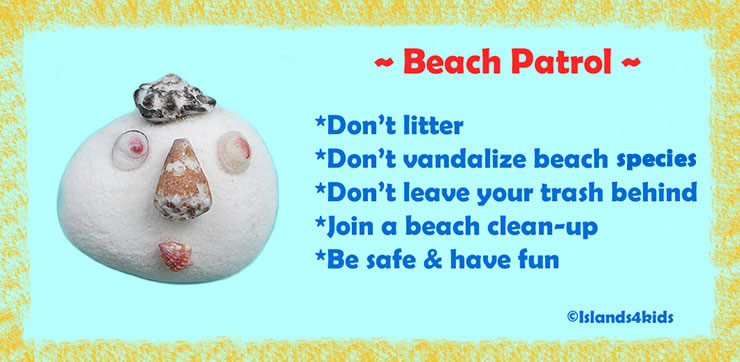
The goal here is PREVENTION. We want to make sure beach-goers no longer litter or vandalize beach resources during their visits. Through education and outreach, we can reduce the amount of waste left behind. Creating signs to post at beaches is one way to get the message across. Schools could also have marine debris lessons to learn about various aspects to the issue, brainstorm solutions, and make posters that the community can use. |
 |
Reactive |
|
| |
 |
The goal here is to RESPOND to damage that is already done to beaches. One way is to clean the beach. You can do this individually while you are visiting the beach or as a group beach clean-up event. You can gather your friends, neighbors, and other community members and have a large event as well! This can also be a great opportunity to raise awareness about marine debris to a wider community and educate them on proper beach-going behavior. |
| |
 |
| |
| References |
1. National Ocean Service. 2014. "Types and Sources". National Oceanic and Atmospheric Administration. http://marinedebris.noaa.gov/learn-basics/types-and-sources.
2. National Ocean Service. 2014. "Great Pacific Garbage Patch". National Oceanic and Atmospheric Administration. http://marinedebris.noaa.gov/info/patch.html.
3. National Ocean Service. 2014. "What We Know About the "Garbage Patches"". National Oceanic and Atmospheric Administration. http://marinedebris.noaa.gov/sites/default/files/gpposter.pdf.
5. Iisands4Kids-Presentation.pdf |
|
|